FunFact for functional scene understanding. Given posed RGB-D inputs, FunFact reconstructs an object- and part-centric 3D map and builds a functional scene graph. Candidate functional relations are encoded as binary variables in a dual factor graph, where cardinality and proximity factors jointly resolve ambiguities via belief propagation, yielding calibrated per-edge confidence scores.
Abstract
Recent work in 3D scene understanding is moving beyond purely spatial analysis toward functional scene understanding. However, existing methods often consider functional relationships between object pairs in isolation, failing to capture the scene-wide interdependence that humans use to resolve ambiguity.
We introduce FunFact, a framework for constructing probabilistic open-vocabulary functional 3D scene graphs from posed RGB-D images. FunFact first builds an object- and part-centric 3D map and uses foundation models to propose semantically plausible functional relations. These candidates are converted into factor graph variables and constrained by both LLM-derived common-sense priors and geometric priors. This formulation enables joint probabilistic inference over all functional edges and their marginals, yielding substantially better calibrated confidence scores.
To benchmark this setting, we introduce FunThor, a synthetic dataset based on AI2-THOR with part-level geometry and rule-based functional annotations. Experiments on SceneFun3D, FunGraph3D, and FunThor show that FunFact improves node and relation discovery recall and significantly reduces calibration error for ambiguous relations, highlighting the benefits of holistic probabilistic modeling for functional scene understanding.
Method
FunFact Pipeline
Loading figure…
The FunFact pipeline. Given posed RGB-D images, FunFact builds a functional 3D scene graph in two stages. (i) Scene Reconstruction: A VLM proposes functional objects, their part labels, and coarse 2D bounding boxes; GroundingDINO and SAM ground these into instance masks, which are cross-validated against the VLM bounding boxes to suppress hallucinations. Multi-view fusion lifts the detections into 3D and aggregates them across frames, yielding a part-aware 3D map. (ii) Functional Scene Graph Creation: A VLM proposes object-object and object-part relation templates; candidate relations are instantiated and encoded as binary variables in a dual factor graph; cardinality and proximity factors are resolved via belief propagation to yield per-edge confidence scores.
Hierarchical Object and Part Reconstruction
A VLM proposes object & part hierarchies
GroundingDINO + SAM ground proposals into instance masks
Parts detected in object-centric crops using proposed labels
Multi-view fusion builds an object- and part-centric 3D map
Functional Relation Proposals
A VLM proposes open-vocabulary relation templates with common-sense priors (e.g., one-to-one, spatial proximity)
Templates instantiated into candidate edges across all plausible node pairs
Factor Graph Inference
Candidate edges → binary variables in a dual factor graph
Cardinality + proximity factors constrain the graph
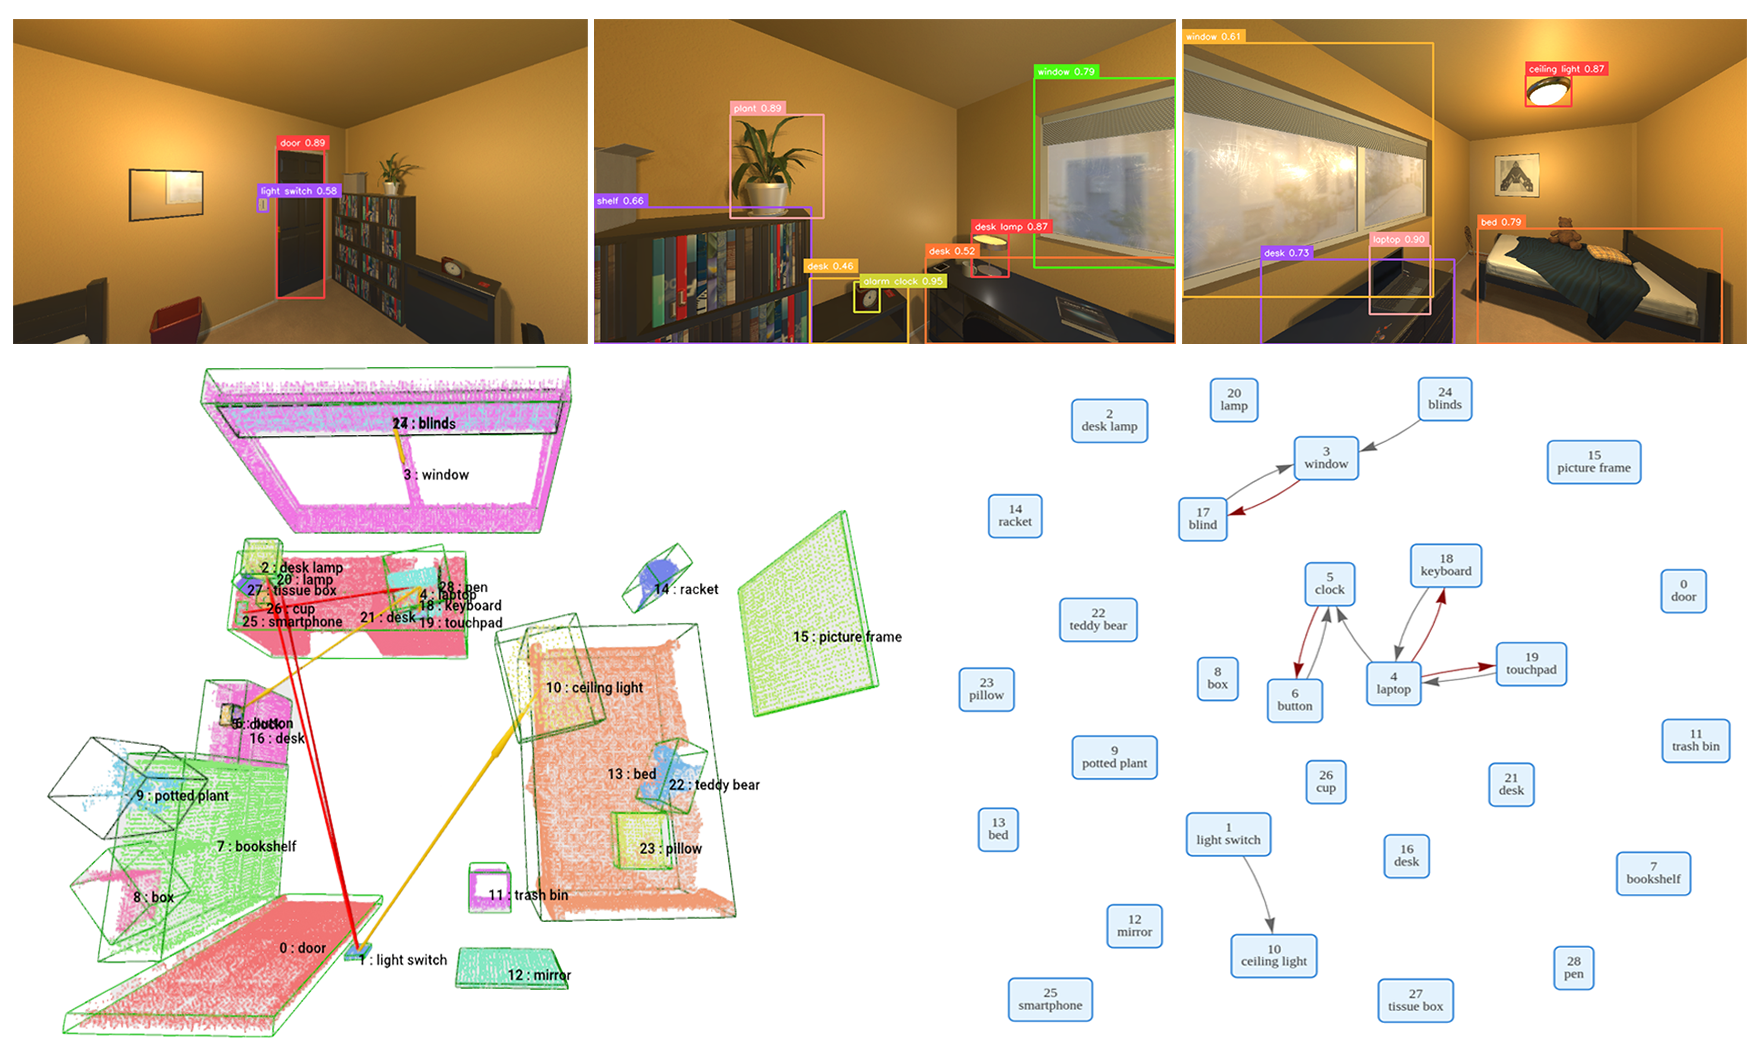
Qualitative results. Top: input RGB images with detected functional objects. Bottom-left: reconstructed object and part point clouds with predicted functional relations (red: confidence < 0.5; yellow: confidence ≥ 0.5). Bottom-right: final functional 3D scene graph after confidence thresholding (red edges: object–part hierarchy; gray edges: functional relations).
Interactive Scene Explorer
Click any node in the scene graph (left) to highlight the corresponding object in the 3D point cloud (right), and vice versa. If more than one bounding box overlaps at the clicked location, the visualizer will randomly select one to highlight; keep clicking until you find the correct one, or try clicking on a different part of the object to disambiguate.
FunThor · FloorPlan313
FunGraph3D · 4livingroom
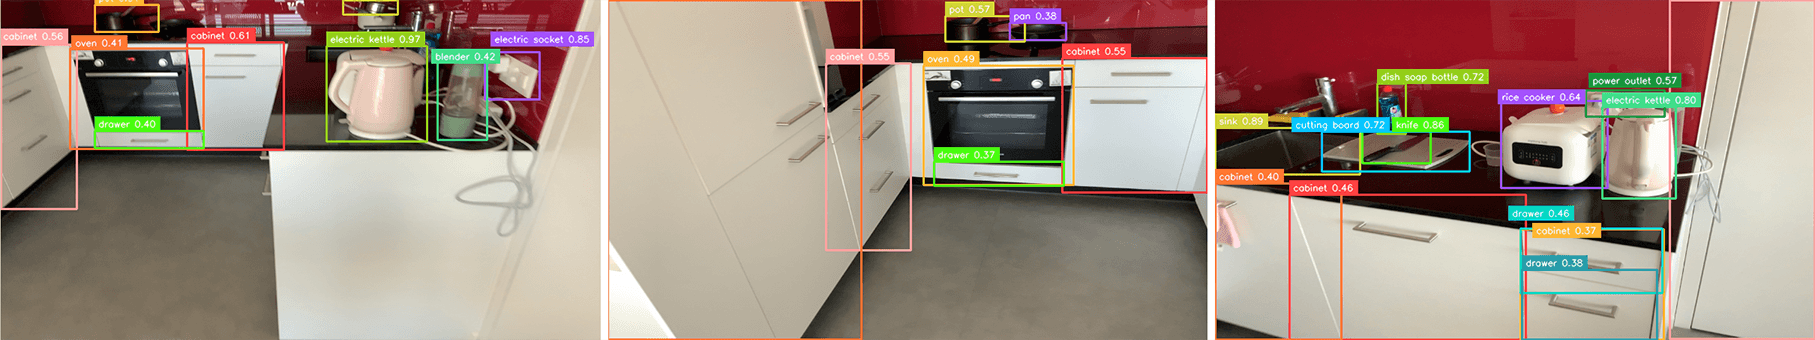
Real-world scene demonstrating that FunFact generalizes beyond the synthetic dataset.
Key Insight
Probabilistic Inference via Factor Graphs
Consider a stove with four knobs and four burners. Naïve pairwise inference treats each knob–burner relation independently, producing 16 unconstrained candidates. Humans resolve this by reasoning holistically: confirming one assignment immediately constrains the rest. FunFact encodes this global structure in a dual factor graph, where scene graph edges become binary variables and cardinality factors enforce structural priors, enabling joint inference that propagates information across the entire scene.
Loading figure…
Dual factor graph construction. Left: candidate functional edges e1–e4 between stove knobs and burners. Right: the dual factor graph where each binary variable xi represents edge ei. Proximity priors pi bias toward closer pairs; cardinality factors Ki and Bi enforce the one-to-one assignment constraint per knob and per burner.
Loading figure…
Evidence incorporation via message passing. Once one knob–burner assignment is confirmed (e.g., by a robot touching the knob), beliefs over all remaining edges update via factor-to-variable messages. Thicker / darker blue edges indicate higher confidence; thinner / lighter edges reflect reduced probability.
Cardinality factors encode soft structural constraints: for a one-to-one relation, each node should connect to exactly one counterpart. The factor penalizes configurations where a node has zero or multiple active edges, with penalty strength controlled by a single parameter b ∈ (0, 1). Proximity factors assign prior belief proportional to exp(−d / λ), where d is the Euclidean distance of the candidate edge and λ is the median edge length in the local candidate set — biasing toward spatially closer connections while remaining correctable by the cardinality constraints.
Dataset
FunThor: A New Benchmark
Loading figure…
Two FunThor environments. Top-down layout (left) showing mapped functional objects; instance and part segmentation with functional edge annotations (right). Ground-truth annotations are derived from the asset properties and interaction rules built into the AI2-THOR simulator.
Existing real-world datasets for functional scene understanding lack systematic, comprehensive annotation of functional relations, which prevents the evaluation of metrics that require true negatives (e.g., Precision, F1, and ECE). FunThor addresses this limitation by leveraging the AI2-THOR simulator to produce rule-based annotations with part-level geometry and dense functional ground truth.
Enables Precision/Recall/F1 and ECE evaluation not possible on sparser real-world benchmarks
Quantitative Results
Benchmarks
Key results:
+23.9% IE Recall@3 on FunGraph3D (44.4 → 68.3) — large gain on interactive element mapping.
+18.9% Triplet Recall@5 on FunGraph3D (29.8 → 48.7) — best overall functional prediction.
7x lower calibration error (ECE-Ambiguous: 0.51 → 0.07) — from holistic scene reasoning rather than per-relation optimization.
Table 1 — Scene Reconstruction. Recall@K (R@3 / R@10, higher ↑) for Objects, Interactive Elements (IE), and Overall Nodes on FunGraph3D. Bold marks the best result per column.
Method
FunGraph3D
Obj R@3
Obj R@10
IE R@3
IE R@10
Overall R@3
Overall R@10
Open3DSG
50.9
58.1
21.8
33.9
33.4
43.6
ConceptGraph
58.0
66.3
2.5
4.1
20.1
25.2
OpenFunGraph
70.7
79.1
44.4
57.6
55.5
65.8
FunFact (Ours)
91.1
96.6
68.3
78.7
77.9
86.2
Table 2 — Triplet Evaluation. Node association, edge prediction, and overall triplet recall as Recall@K (R@5/R@10 on FunGraph3D, higher ↑).
Method
FunGraph3D
Node R@5
Node R@10
Edge R@5
Edge R@10
Triplet R@5
Triplet R@10
OpenFunGraph
45.8
49.3
65.1
91.4
29.8
45.0
FunFact (Ours)
71.1
80.0
67.9
79.9
48.7
63.9
Table 3 — Comprehensive Evaluation on FunThor. Mapping Recall@3, functional edge Precision / Recall / F1 (%, higher ↑), and Expected Calibration Error (ECE, lower ↓). ECE-Ambiguous targets light switches and stove knobs specifically.
Method
Mapping (Recall@3 ↑)
Functional Graph
ECE ↓
Obj R@3
IE R@3
Overall R@3
Prec ↑
Recall ↑
F1 ↑
ECE All
ECE Ambig.
OpenFunGraph
54.6
41.1
51.2
23.4
12.2
16.0
0.43
0.51
FunFact (Ours)
68.2
69.5
68.5
31.9
49.3
38.7
0.36
0.07
Citation
BibTeX
If you find this work useful, please cite:
@inproceedings{Fu_2026_funfact,
  title     = {FunFact: Building Probabilistic Functional 3D Scene Graphs via Factor-Graph Reasoning},
  author    = {Fu, Zhengyu and Zurbrügg, René and Qu, Kaixian and Pollefeys, Marc and Hutter, Marco and
               Blum, Hermann and Bauer, Zuria},
  booktitle = {Proceedings of the IEEE/CVF Conference on Computer Vision and Pattern Recognition (CVPR)},
  month     = {June},
  year      = {2026}
}